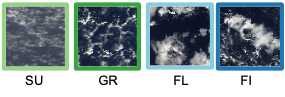
Shallow convection in the downwind trades occurs in form of different cloud patterns with characteristic cloud arrangements at the meso-scale. The four most dominant patterns were previously named Sugar, Gravel, Flowers and Fish and have been identified to be associated with different net cloud radiative effects (CRE).
To understand their climatological importance and potential change under a warming climate, we investigate their characteristics and associated meteorological environments
if this observed covariability of cloud characteristics and meteorological environments is also replicated in simulations is being evaluated by realistic large-eddy simulations of the recent EUREC4A field campaign.
Summary
The combination of automatic, satellite-based detections of meso-scale organizations paired with ground-based observations from the Barbados Cloud Observatory create a unique framework to elucidate the patterns of organization of shallow convection in the maritime trades
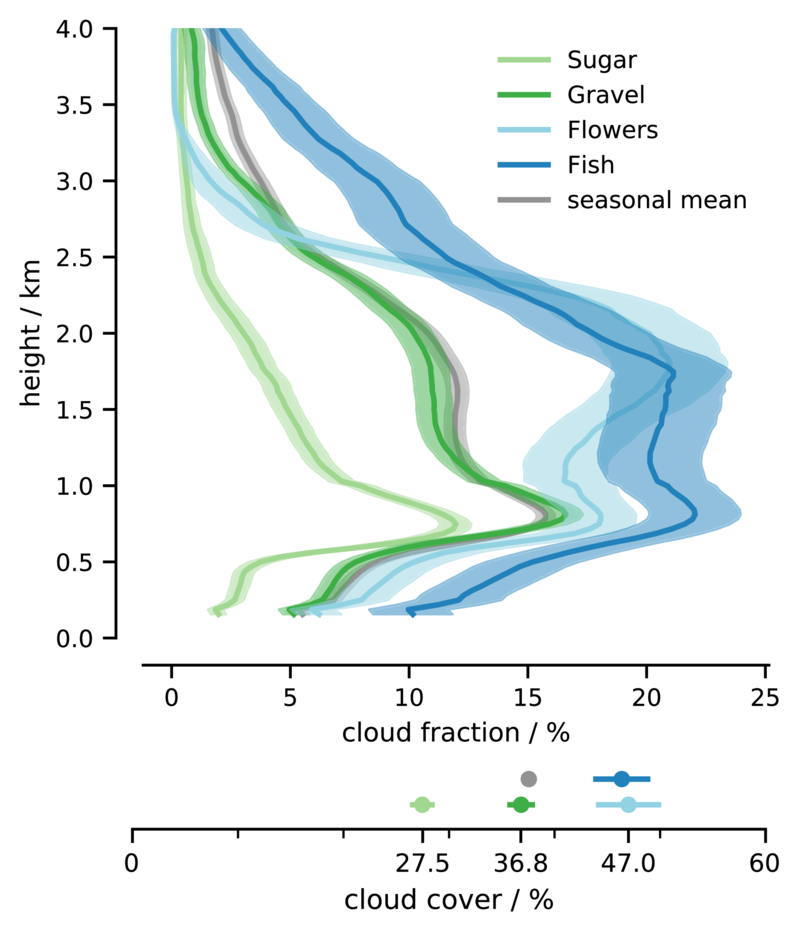
Cloudiness of meso-scale patterns in the trades is characterized by the stratiform cloud amount and less so by cloudiness at the LCL
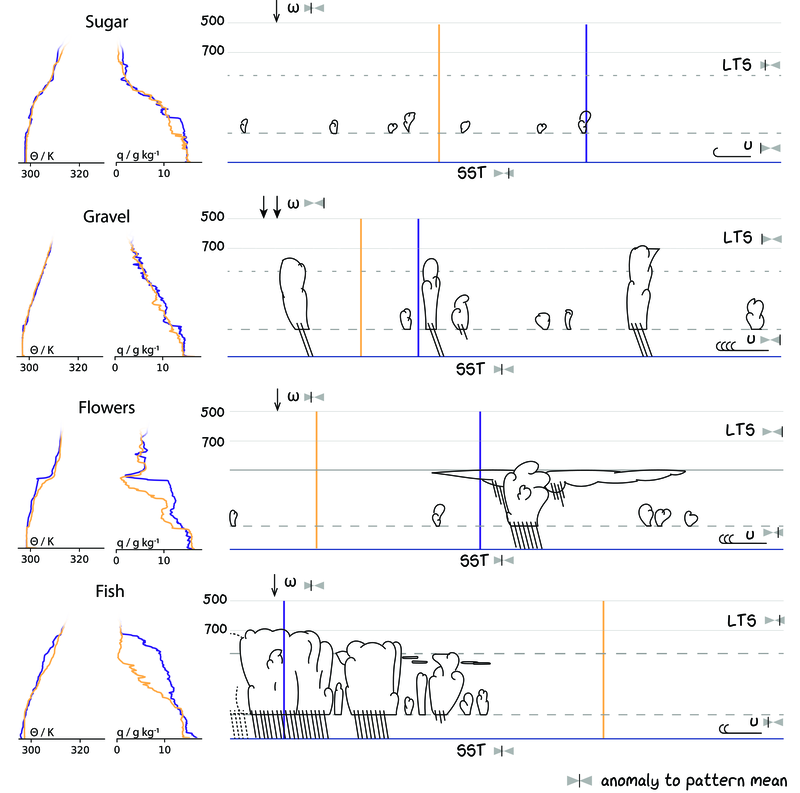
Stratiform layers are one of the most important drivers of the cloud radiative effects but are dynamically different depending on the pattern.
Patterns of cloudiness can be attributed to different trade wind environments, that are
distinct in thermodynamics and large-scale forcing
Synthetic infrared satellites images will help to compare the model output to observations in terms of e.g.
cloud cover and its variation on different scales
On the entire domain, the cloud cover might agree, but differ on e.g. the cumulus scale
degree of organization
The sample below shows a rather regular distribution of shallow cumulus compared to the observations.
size distribution
Snapshots of synthetic (left) satellite images based on 600m LES and actual (right) GOES16 ABI channel 13 satellite images.
How this observed covariability is represented in simulations is ongoing work.
Method: Neural network detection
Neural network application to GOES16 ABI infrared images and the respective observations made at the Barbados Cloud Observatory (lower pannel). Barbados is in the lower left corner of the satellite image.
Neural network (NN) similar to Rasp et al. (2020), but trained with MODIS infrared images and applied to GOES16 ABI images
The usage of IR and the geostationary satellite data enables the classification of the cloud scene throughout several times a day (in case of GOES16 ABI occasionally down to 1min)
Observation: patterns are distinct by their stratiform cloud amount
Measured cloud fraction profiles and total cloud cover of meso-scale cloud patterns
Cloudiness varies little at the lifting condensation level
Most of the variance across patterns is confined to the trade-inversion
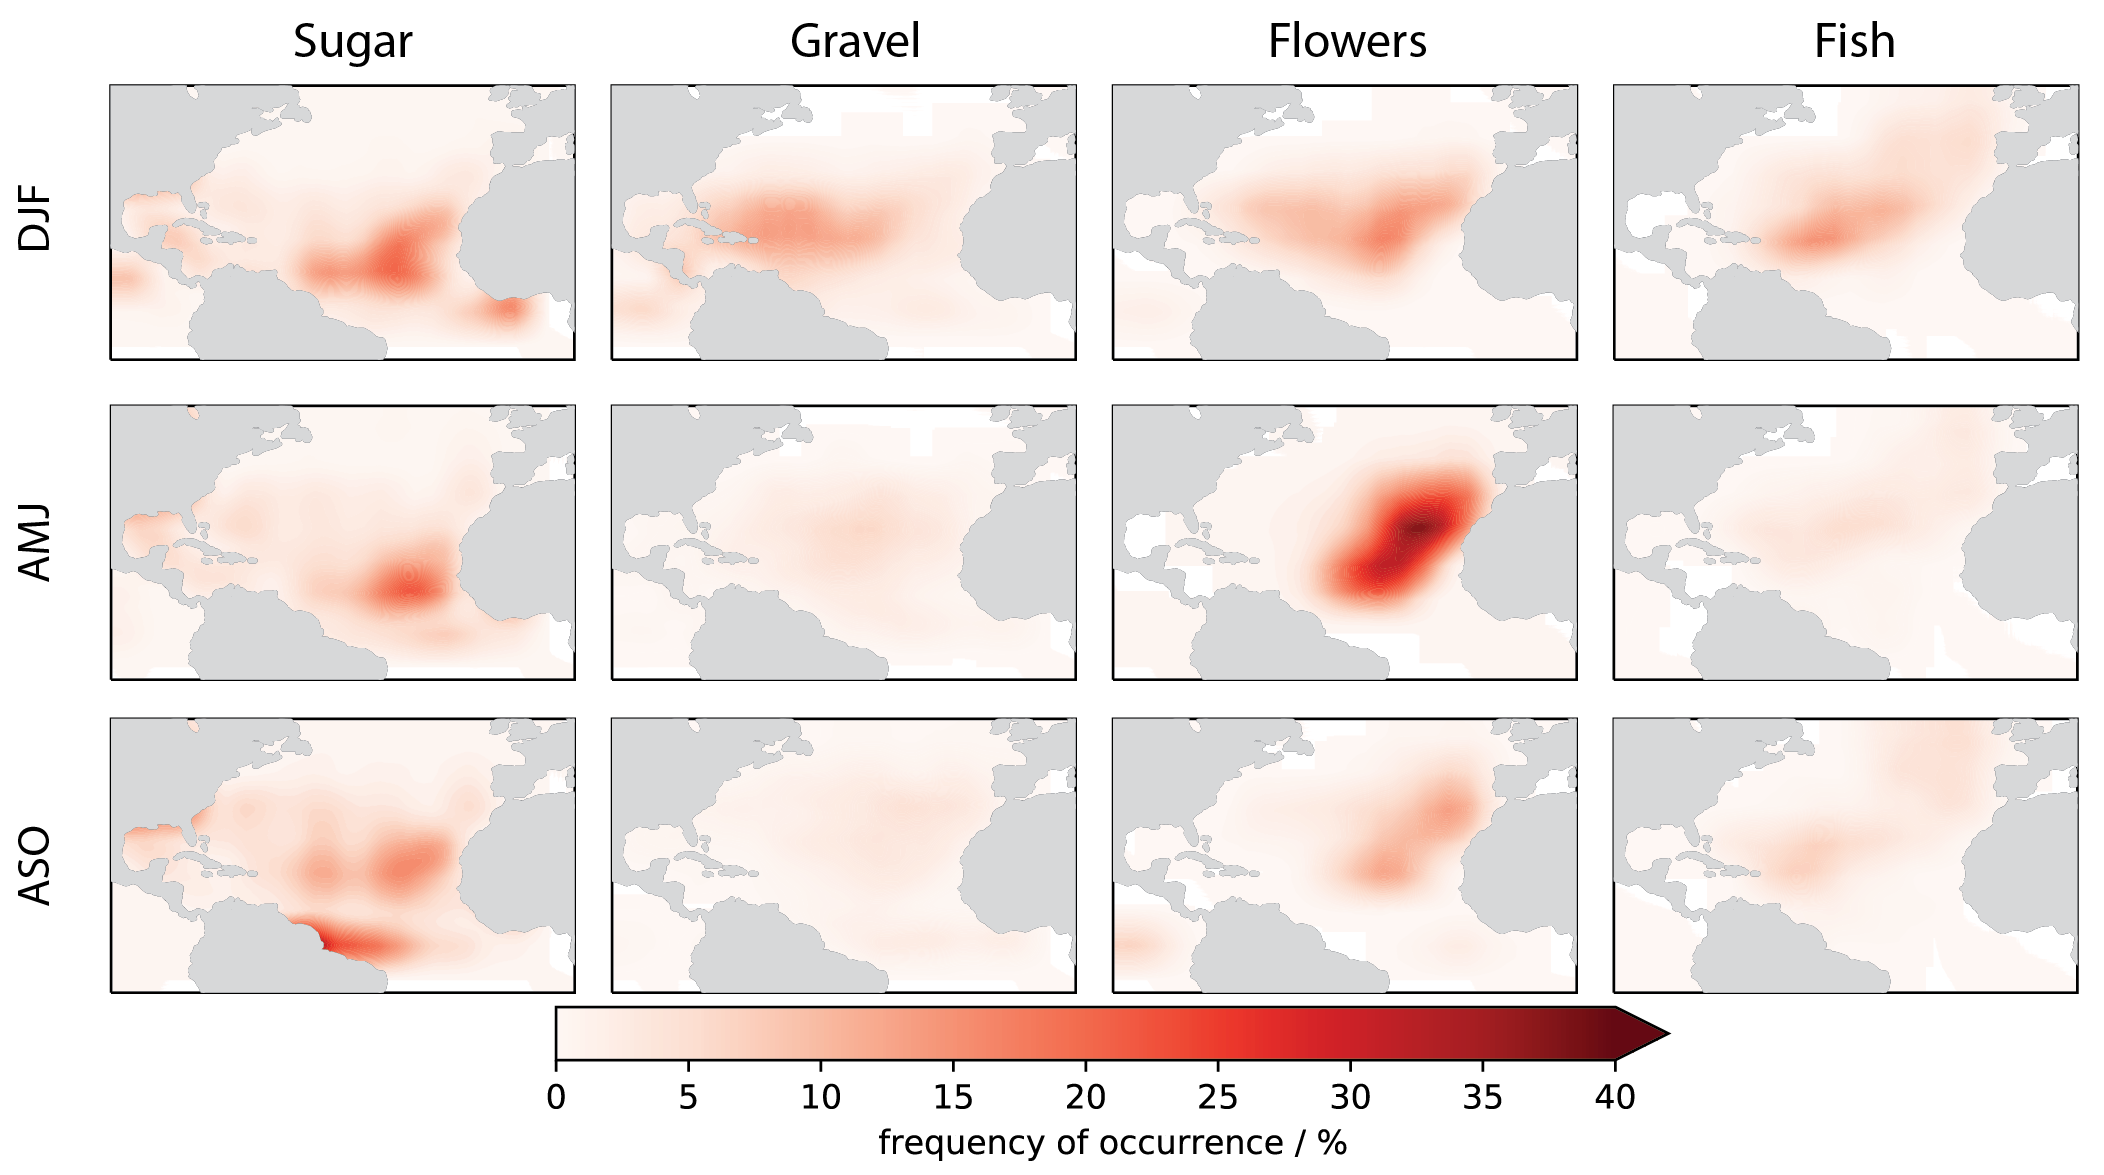
Observation: most pattern peak in winter
Seasonal distribution of shallow convection patterns in the North Atlantic.
Patterns occur preferentially in the winter season
Sugar pattern is present in all seasons and shifts with the ITCZ
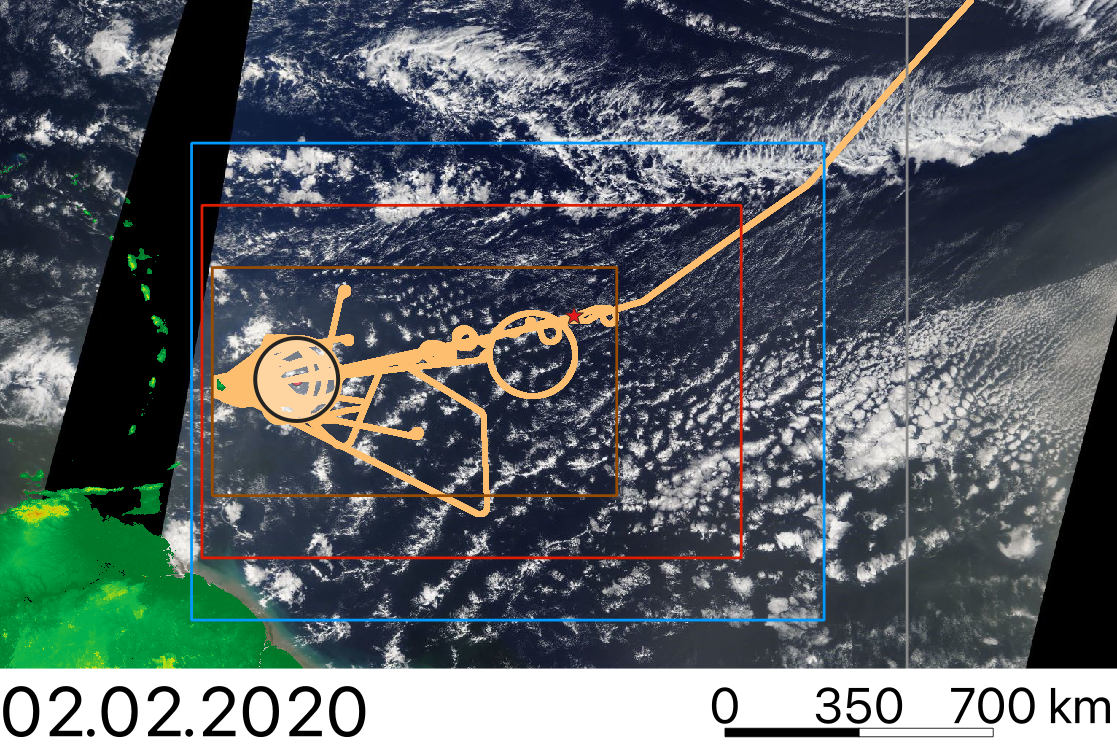 Overview of ICON LES domains.